Showing posts with label TSXV. Show all posts

Sunday, August 21, 2011

Bottom for Summer 2011 is In!

Goombarh 70 - August 21, 2011
Good Sunday,

Further to my last note of #69, I've thought to add some words to the encouragement of getting readers back into the market.  Yes, fear is all around, as depicted by the news media and specifically by some of the analytical postings on Seeking Alpha such as the following:

These writers are knowledgeable and well meaning, but the Goombarh thinks they are over analyzing, and they do not give a course of action.

Speaking of action, there are yearly doldrums as depicted across the indices following in the comparison chart, the Venture is the key index that I follow, where the juniors that I invest in are traded, but the S&P 500, the Wiltshire and the TSX are shown as well.  Note the green highlighted box showing the summer lows and the swift fall gains.  I believe, that this year 2011, the same picture will play out, as I believe the summer bottom is in with the prevalent pessimism out there.
A truism for the best gains is the lowest entry price possible for your stock position.  Therefore, the action for investors should be careful placement of your investment positions in stocks that have made their lows for this summer.  The gains are coming in September to December. 

As I have completely revamped my own portfolio and am now positioned for the possible fall rising, I thought it would be remiss of me to not mention that to you people, so therefore, now I have mentioned it.  Good luck.

Until next time,
Marco G.

Thursday, July 7, 2011

2011 Summer Bottom for Mining and Minerals is In!

Goombarh 64 - July 7, 2011
Good day,

I hope this note finds you well and enjoying your Summer.  A couple of good articles and the possible market bottom leads me to come out with this note.

Firstly, the Shanghai Composite appears to be leading the SP 500 to new highs:
The SSEC has bottomed on strong resistance level, and the Chinese tightening to reduce growth to 7~8% has now all been priced in.  The latest bank rate increase is also behind us, so the demand for commodities should continue.  As to precious metals, I hold the view, that we are continuing higher into the fall.  There is a strong analysis, that I am in agreement with, of the Chinese impact on the world economy going forward by Julian Philips:  The link is here:
http://www.kitco.com/ind/AuthenticMoney/jul042011.html

The SP 500 is moving to new highs?
With the regular markets in a strong positive mood, this makes the riskier small miners, that I am interested in, all the more stronger.  There is a Ken Fisher, outlook, that makes a good general primer on what to expect for the second half of this year.  It is attached as a PDF document.

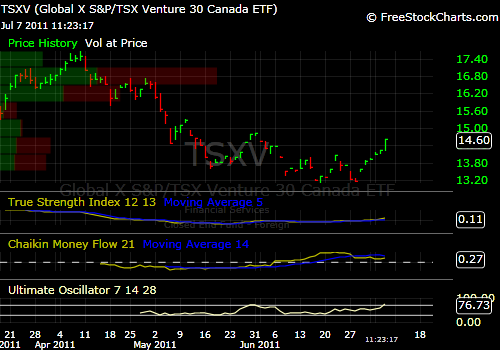
The TSX Venture ETF as a proxy for the Venture exchange has turned around:
The rebound in the Venture exchange has brought my portfolio back a bit from the declines, and now is possibly the beginning of a fall rush.  It does seem a bit early, compared to previous years, but Gold is strong, the SP 500 is strong and the Venture is rebounding.  Anyways, how can anyone predict the future?  The main point is that this is the time to be adding some speculative investments with the idea of good PR's coming and the Fall run for metals and commodities; it is just time to prepare for that.

The Agricultural ETFs, DAG, that I was monitoring have taken a fall, and now may be a good time to nibble.
I am playing around with the idea of using DAG as a cash holder.  The possible gains from DAG are good, but are not high enough for me compared to speculative miners.

So, good fishing to you as you pick your speculative investments for this Fall's run!

Until next time,
Marco G.
http://goombarhsedge.blogspot.com/

Monday, September 27, 2010

Mysterious Monthly Moves of Metals Miners

Mysterious Monthly Moves of Metals Miners


By: Marco G.


September 27, 2010


http://goombarhsedge.blogspot.com/


In 2009 Fall, there was a peculiar price pattern that was happening with metals miners. I was first alerted to this by a colleague who writes under the pseudonym of “HardRock” (suitable name). Since then, the author has often pondered about the movements and without result. The author and HardRock were both hard pressed to come up with any strong explanations for these moves.

Monthly moves of Large Cap Miners, SLW, CLF and TCK.

In the chart below for Fall 2009 (click to enlarge), the author has circled the monthly moves up and down of three large cap miners: Silver Wheaton – SLW, Cliffs Natural Resources – CLF and Teck Resources – TCK. SLW is the author’s favorite “La Crème de La Crème” Silver royalty company. CLF is a favorite of the author’s in coal and iron ore mining in America and Australia. TCK is a recovering, Americas based diversified miner of coal, lead, zinc and copper with minors in gold and silver.


Figure 1: Fall 2009 for SLW, CLF & TCK. Note the cyclical movements up and down every month.

The stock prices for these mining equities seemed to be making price movements on a regular basis monthly.

Cyclic Monthly Movements

The price movements appeared to correlate to the days of the month quite nicely. Starting at September 1st the stocks would move up in price until at the middle of the month. Then the prices would decline until towards the end of the month and would hit a low in the last few days of September. Then with a new month beginning, the cycle would repeat rising again. This pattern held for two months and then in November there was no decline until midway through December. So the cyclic pattern for November was stretched into mid- December.

Monthly Moves of TSX Venture, Gold (GLD) and Gold Miners (GDX)

The monthly movements that we noticed weren’t limited to the previous large cap miners, but it was observed as well in the TSX Venture Exchange Index, the price of Gold (using GLD ETF as proxy) and the Gold Miners Index (GDX). The chart of these market indicators is displayed below (click to enlarge).


Figure 2: Fall 2009 for $CDNX, GLD and GDX. Note the monthly cycles for the prices moving upwards and dipping towards month ends.

The monthly price movements appeared to correlate with the days of the month. This is wonderful, if a movement like this is predictable for these stocks.

Possible Rationale for Movements

Here are the author’s thoughts for the reasons behind the cyclic monthly movements. The rise in commodities and metals prices as in the Commodities Research Bureau ($CCI) Index drove the mining equities last fall.


Figure 3: CCI move in Fall 2009. Note the significant rise.

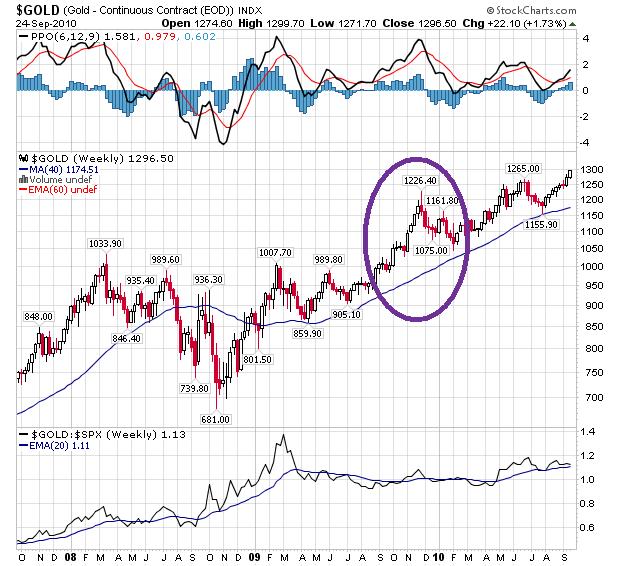
The price of Gold also made a strong move upwards last fall, rising from the Summer doldrums and peaking in late November.


Figure 4: Gold in Fall 2009. Note the significant rise.

These two factors drove the move for the TSX Venture exchange and mining equities in general. The dip at September month end may be attributed to the end of the quarter and for investors taking their profits for the strong move up since March 2009. The dip at the month end of October is attributed to investors taking profits and re-positioning for the tax year end. The dip at mid month in December is attributed to the annual hiatus and slow-down for the winter holiday season. The correlation to the months is merely the average investors’ methodical way of managing their portfolio based upon the time of year. This may be an explanation, but the rationale is not strong and I don’t really believe it myself.

Predictable Monthly Movement of Miners?

The investor in the markets needs any help he can get. If there is a valid repeatable reason, behind these cyclic monthly moves, then the investor being apprised of them may be able to adjust their equities positions accordingly. The author was wondering about this effect this morning and in examining it, noticed remarkable similarities to this Fall of 2010. Is the dip this morning, September 27th, 2010, the beginning of the larger dip for September month end happening? Is there more to the rising prices coming in October, November and December? And with the strong beginnings of moves in commodities and Gold this year, “Will this cyclic mining thing repeat this Fall?”


Disclosure: The author is long mining equities.


Important Disclaimer


The information and opinions contained within this document reflect the personal views of the author and should be viewed as food for thought and amusement only. The author may from time to time have a position in any of the securities mentioned. There are no guarantees of the accuracy, reliability or completeness of the information contained herein. Independent due diligence and discussions with one’s own investment and business advisor is strongly recommended. These writings are not to be construed as an offer or solicitation with respect to the purchase or sale of any security or as an endorsement of any product or service. We do not request or receive compensation in any form in order to feature companies in this publication. It is prohibited to copy or redistribute this document to any type of third party without the express permission of the author. This document may be quoted, in context, provided proper credit is given.

Friday, September 24, 2010

Fall Forecast – Craving for Commodities

Fall Forecast – Craving for Commodities


By: Marco G.

September 21, 2010

http://goombarhsedge.blogspot.com/


Fall officially started yesterday, and the leaves are turning red; and this morning on my monitor screen, all my stock indicators are mostly green. Never mind the leaves, it is now time to stay indoors and grow some green in the markets. The author decides to examine some of his favorite charts for indications of what will happen up coming this Fall.

Volumes for TSX-V are High

The author specializes in commodities and mining stocks and the first screen that I glance at for indications of health is the TSX Venture exchange. This is the smallish Toronto, Canada based exchange where the majority of the world’s small mining companies are listed. The chart below, tells quite a tale of almost a continuous run upwards since July 20th, 2010.

The market volumes are high since the beginning of September, supporting the move upwards. The Chaikin Money Flow (CMF) displays a positive mountain of cash buying moving in.

And the PPO is showing strong momentum in this market. The PPO or Percentage Price Oscillator is another moving average indicator, but expresses the output as a percentage.

For examining the longer term picture we use the chart for the TSX Venture below, we can see that the trend is continuing upwards after the hiatus for the “Sell in May” in the early part of this Summer.


The risk appetite for smaller junior miners appears to be back. The volumes compared to the volumes in Fall of 2009 are higher, earlier and more positive, indicating buying.

Copper Shortage Looming

In the news, the commodities forecasters have been telling us about the upcoming shortage for copper that is looming nigh. We examine the chart following for Copper Futures.


We see that since June the copper price is trending upwards and is regaining the high ground lost since prior to the 2008 crash. The copper futures price is known as Doctor Copper, for giving good indications about the state of the future economic activities.

TSX Golden Cross

Next we look at the TSX Composite Index based in Toronto Canada. This index is resource heavy and is a larger and quite reliable leading indicator as Canada is America’s largest trade partner and is much influenced by the American economy. The chart below of the TSX is indicating bullish activity moving forwards.


There was a bullish Golden Cross of the 50 DMA over the 200 DMA that happened last week on about Sep 15th, 2010. The positive CMF over the summer is telling the early positioning of the smarter monies. We need to watch for higher volumes in this market to confirm this bullish indicator in that the bull market is back.

Wilshire leading US Economy Back

The author likes using the Wilshire 5000 Composite Index as it is more sensitive than the traditional large index indicators (Dow Jones, S & P 500) of economic health. The chart indicates that the moving averages may be converging and may be possibly follow the TSX index in a Golden Cross of its own. The CMF has been positive, which is supportive.

Steel Versus World Wedge

The author uses this Steel Stocks versus the World Stock Index ratio displayed in the chart below as another measurement of economic health. Steel demand is a strong leading economic indicator.


From the chart above, we see a narrowing wedge displayed whilst the market has been in oscillation up and down and indecisive as to which way to go. The answer it seems will be pretty quick in coming as the wedge is rapidly coming to a point. Which way will this indicator break towards?

Craving for Commodities

From my previous charts, the author is forecasting a resumption of the recovery in North America and especially for metals, mining and commodities stocks. This will be supported by a broad based recovery in the overall stock markets as the public comes to this realization. You the astute reader will be best positioned for this recovery by looking in the commodities, metals and mining sectors for good values.

Disclosure: The author is long junior mining equities.


Important Disclaimer


The information and opinions contained within this document reflect the personal views of the author and should be viewed as food for thought and amusement only. The author may from time to time have a position in any of the securities mentioned. There are no guarantees of the accuracy, reliability or completeness of the information contained herein. Independent due diligence and discussions with one’s own investment and business advisor is strongly recommended. These writings are not to be construed as an offer or solicitation with respect to the purchase or sale of any security or as an endorsement of any product or service. We do not request or receive compensation in any form in order to feature companies in this publication. It is prohibited to copy or redistribute this document to any type of third party without the express permission of the author. This document may be quoted, in context, provided proper credit is given.