Saturday, March 5, 2011

This Guy is Chief of Company managing $58 Billion in Hedge Fund.

Very interesting views, Ray Dalio has.  Note his strong view on holding Gold and he believes large funds and sovereign wealth and other should hold a portion.  This view must be catching, and bodes well for precious metals going forward from here.


What is also amazing is that his fund returned 40% in 2010.  It is a known fact that as your holdings becomes larger, that it becomes harder and harder to give strong returns, as the large opportunities are just not there.  Therefore for his huge fund to return 40%, he is probably making multiples on many of their investments, and the average works out to 40%.

Tuesday, March 1, 2011

Goldcorp Warrants (GG.ws, TSX:G.wt.g)

Goombarh Flash 18,  Feb 25th, 2011
===============================================

Good Morning,
Though I have been a critic of Goldcorp, I am not against making money on this glamor stock.  They released terrific results yesterday, and as I have said previously, they are doing the right things with divesting low grade Osisko and buy high grade Andean.

Note the chart above, their soon expiring warrants are seriously lagging the stock, probably funds divesting after  year end with close expiry in June 9th, 2011.  There are 8 million of these critters and they have become seriously leveraged to the stock price ~ 16. Goldcorp warrants (GG.WS, TSX: G.wt.G) should move with the stock price upwards and with the Gold price upwards and maybe peak in May before expiry in June. Pricing is sub $3 presently and strike price is $45.75 Cdn which is the price right now.  Therefore, no value in warrant except as an option should the price move upwards beyond $49 Cdn, then these warrants become breakeven.  Beyond $49, each $1 stock moves, the warrant should move $1 also giving a 16 to 1 leverage.

This is definitely risky as if GG doesn't move up, then you lose your whole investment.  However if GG moves to $62, $52, then you have a double.  I have bought and am holding.

Until next time,
Marco G.
http://goombarhsedge.blogspot.com/

Wednesday, February 16, 2011

Silver Bull in Wave 3 - Feb 16, 2011

Goombarh 33,  Feb 16th, 2011
Good Morning,
Just one chart to show where we are at in the Silver Bull.  Came across this quite accidentally when surveying my positions and watch list stocks.  The chart is of SIL, Silver miners ETF.
A longer time frame certainly improves the vision and perspective, doesn't it.  Sometimes one can not see the forest for the trees obscuring the view! 
This chart reminds me of Elliot Waves, where just impulse wave 1, 100% (double) move has occurred this fall and wave 2, a 50% correction has just ended on Jan 25th or so.  Then we are in the beginnings of Impulse wave 3, which as you students of Elliot may know, will be the most powerful and longest up wave.
The author has not seen this view of the charts anywhere recently, and so you the reader should treat this information as an early participant, to take advantage of this information.
What is this chart telling us...We are in the middle of a massive Silver Bull!

Where are we headed in this Silver Bull...well, wave three according to Elliot theory is expected to be 1 to 1.63 times the length of wave 1; this may take the SIL chart to....an estimated $34 to $42 range or an estimated 41% to 75% gain from today's price

Does this work?....Yes, mostly, my experience is that Elliot is a pretty good predictor of value or stock price...within the accuracy range of 20% or so.

Can I apply the same info to my stock...Yes, you may be able to roughly translate the 41% to 75% move to your own Silver stock.  Of course your Silver stock will be different dependent upon the stock characteristics, but you now know and have the comfort that the portended trend is upwards for another 50% in the next half year or so.

The weakness of Elliott, in my experience, is that the time frames are not very finite...that is the dates for the peaks are uncertain.

What else is the chart telling us?
1.      Miners are leveraging the Silver metal itself; note the red trace is for SLV the Silver metal ETF.  Note that SIL leveraged upwards but did not leverage downward in the pullback, which just indicates the strength of this move, and continued bullishness from the market participants.
2.      Volume increase is up; bullish move.
3.      True Strength has bottomed and is moving up.
4.      Chaikin Money flow has bottomed and is moving up.

Is this infallible?....Of course this is fallible...this is the stock market ...which is an extension of our world...and anything is possible for the future.  There are no hard and fast future crystal ball predictions, just possible indications.

So position yourselves readers, the best is yet to come for Silver miners!

Until next time,
Marco G.
http://goombarhsedge.blogspot.com/

Thursday, January 27, 2011

Precious Metal's Sentiment Changes and Bottoms!

Precious Metal's Sentiment Changes and Bottoms!  
The author was perusing charts whilst devouring his breakfast steak (well, maybe not breakfast, but real thick beef loin, as I had been surviving on only coffee for 5 hours this morning), and I came across this startling chart for my bellweather Gold stock, Goldcorp (GG, TSX: G), displayed following:  (click to enlarge)
The large white candle for this prime Prima Donna Gold stock yesterday stands in stark contrast to the declining red candles since December.  Though today, there was red, the fact remains, that quite possibly sentiment has changed for the Gold and precious metals sector.  Okay, not so fast, maybe not changed, and just one stock, but indicating some early thinkers have initiated change, and the correction may have bottomed.  Looking above the price chart, the PPO (Percentage Price Oscillator) is showing the faster average (black line) poised to cross over the slower average (red line).  The PPO is similar to the MACD (Moving Average Convergence Divergence) but uses percentages rather than absolute prices).  The PPO black indicator is poised to cross the slower red line supporting the idea of bottoming of prices and the change of sentiment.  At the bottom of the chart, the CMF(Chaikin Money Flow) has gone less negative, again indicating less money leaving this stock than previous.  (Eh, Marco, grasping at straws here --less negative, rather than turning positive, tut..tut!). 
Goldcorp is a high quality recognized Gold stock, and if smart money is moving in, then this bears paying attention to.  Note that earnings season and end of fiscal year for these large cap producer stocks is just around the corner, and the precious metals miners that are not hedged should be enjoying rather high prices for their commodities sold this past fall and winter.  Is this stock positioning for the good news expected?
To extrapolate the idea for the precious metals sector, the XAU to Gold ratio chart was examined.  The XAU is the 17 precious metal stocks index that is traded and the ratio is the indicator of leverage or lead over the Gold price.  The absolute ratio is not important, rather it is how the graph looks relative to its history.  The chart is following:  (click to enlarge)
Examining the graph above, the information is similar to Goldcorp's, the long white candle yesterday overwhelms the previous red candles and brings the ratio back over the 200 day ma.  The $XAU:$Gold ratio PPO is also indicating bottom and change in sentiment.  The Gold stocks may have turned and begin again to leverage the price of Gold.
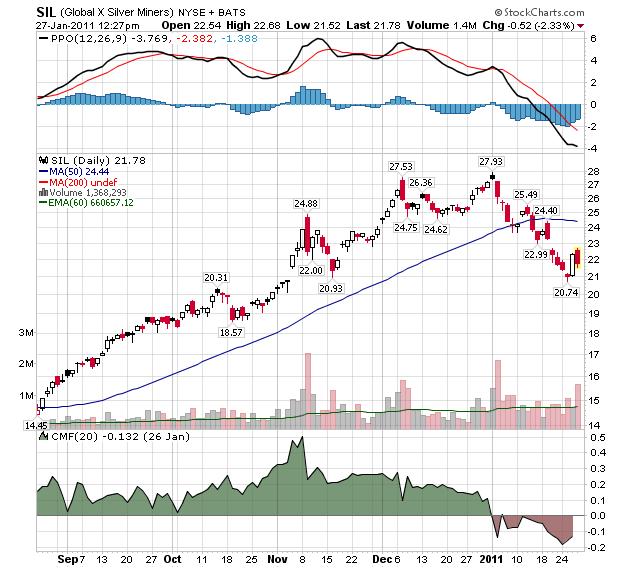
Okay, what about the Silver sector?  Perhaps the author's call for Silver bottom last week was a little bit early.  The chart for SIL, the ETF of the top Silver miners in the world follows:  (click to enlarge)
The chart for SIL above is also displaying a long white candle yesterday, and red for today.  The SIL stock price has declined almost 30% since the beginning of the year.  Is not Silver expected to move more than Gold?  Are not the Silver mining equities expected to leverage upon the Silver price moves?  (Yes, the equities also leverage the Silver price moves downwards)  The early smart money seems to be investing now in the Silver equities.  The author posted  a previous listing of possible suspects a few postings back, here.
Finally, just to ensure, that we are not just out in left field all alone, let us examine the health of the Canadian Venture Exchange, the home of the majority of Junior mining stocks.  Note that Seeking Alpha contributor J. S. Kim has just posted an exemplary article about investing in mining juniors here.  The chart of the Venture Composite Index follows:  (click to enlarge)
The chart for the Venture appears to have idled since the 2011 year started, but is showing a low 3 days ago and a white candle for yesterday.  The chart looks healthy, though some detractors may say the chart appears to be topping.
Perhaps, this may be a wise time to position oneself in selected Precious Metals Junior mining stocks?

Disclosure: The author is long Junior mining stocks.
Important Disclaimer
The information and opinions contained within this document reflect the personal views of the author and should be viewed as food for thought and amusement only. The author may from time to time have a position in any of the securities mentioned. There are no guarantees of the accuracy, reliability or completeness of the information contained herein. Independent due diligence and discussions with one’s own investment and business advisor is strongly recommended. These writings are not to be construed as an offer or solicitation with respect to the purchase or sale of any security or as an endorsement of any product or service. We do not request or receive compensation in any form in order to feature companies in this publication. It is prohibited to copy or redistribute this document to any type of third party without the express permission of the author. This document may be quoted, in context, provided proper credit is given.

Tuesday, January 4, 2011

Sample Notes and Flash for Readers on Email List

As we enter the year 2011, the markets are just as inscrutable as previously.  The possibility of a global economic recovery is promising, yet there are still many reasons to be wary.  Where should one dip their toe into the investment markets?

I am a firm believer in the rise of emerging markets and a firm recovery in North America.  I believe the safest and most reliable gains will be in the basic materials sector.  For myself, I am positioned in smaller miners and precious metals explorers and special mining situations.

For readers, interested in a sporadic notes email, just pop me your email address and I will put you on my distribution list for my market thoughts and occasional flashes.

Marco Goombarh

================================================
Goombarh 20, Jan 4th, 2011
Good Morning,
Just sitting and examining the news, looking for a bit of inspiration here, while Gold/Silver is showing volatility and dropping about 2%.  Just wondering about the AGQ, double bull Silver ETF down 4%.

Floods in Queensland is affecting world coal production.  About 50% of the world's coking coal comes from there and may be affected for a few months, due to the widespread flooding covering an area the size of France and Germany.  See Bloomberg news here:
Interestingly, the US coal miners have just been on a tear in the last week.  CLF, MEE, PCX, CLD.  Similar for the US listed China Coal miners, SCOK, LLEN, PUDA.

An interesting posting about mining at Seeking Alpha:

Noticed Alco is up 4% while rest of miners are sagging.  Support for the idea of Aluminum in a new upswing.

Copper has hit new highs and is driving copper miners.  Norsemont and Mercator Minerals are both up.

Rare earths are certainly in a frenzy, with AVL and REE up large, but I am afraid, that I have no insights or comments about those, except that I am not a participant and I don't plan to be. 

Almaden (AAU, TSX:AMM) is up with anticipation of the epithermal gold drilling results to be released in one large batch.  My previous thoughts on that:

As stated previously, I am expecting good news from Great Basin Gold (GBG) and am nibbling to increase my position prior to the results expected at the beginning of February.

Longer term, I am expecting to pull some monies out from Gold companies as they rise and re-deploy to the smaller base metals miners.  I see rises for aluminum, Zinc, Nickel and other metals that will be needed in recovery, but have not yet participated in gains.

Overall, I am doing nothing, but just sitting, watching and digesting the news, as I am keeping steady with the previous positioning and awaiting an inspiration for any new trading ideas.

Marco G.
http://goombarhsedge.blogspot.com/
============================================
Goombarh Flash 11, Dec 24th, 2010
Good Morning,
Just had a chance to go over the Great Basin Gold (GBG) transcript of their conference call on November 16th.   Wow, they are talking of 5000 tons of Gold ore that averages 15 ounces per ton, on page 15:
"WE CURRENTLY -- IF YOU JUST TAKE THAT YOU'RE LOOKING AT ABOUT 4,500 OR 5,000 TONS, AND WHAT WE'VE SEEN IS THAT IN
THE HIGH-GRADE AREA WITH A VEIN PHYSICALLY IS, WE CAN MINE CURRENTLY OUT OF THAT 80 IS COMING UP WITH ABOUT 15
OUNCES PER TON --. 15 -- YES, ONE, FIVE."
Link to transcript:
Link to quarter presentation:
Also on page 4, Ferdi's talking about being cash flow positive in this quarter ending December 31st:
With the increased production from Hollister and first production ounces from Burnstone, we expect to be cash flow positive from operations in quarter four 2010.
What with the possibility of some of the super bonanza high grade Hollister ore hitting the books and also turning cash flow positive, GBG should have some great news in mid -February, 2011.
Smart people should begin to position themselves appropriately. 
Marco G.